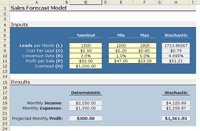
Sales Forecasting Example
[ Monte Carlo Simulation Basics ] ![]()
![]() [ Generating Random Inputs ]
[ Generating Random Inputs ]
Our example of Monte Carlo simulation in Excel will be a simplified sales forecast model. Each step of the analysis will be described in detail.
The Scenario: Company XYZ wants to know how profitable it will be to market their new gadget, realizing there are many uncertainties associated with market size, expenses, and revenue.
The Method: Use a Monte Carlo Simulation to estimate profit and evaluate risk.
You can download the example spreadsheet by following the instructions below. You will probably want to refer to the spreadsheet occasionally as we proceed with this example.
Download the Sales Forecast Example
 MCExample_SalesForecast.zip
File Size: ~420 kB
Requirements: Excel 97 or Later
No Macros Used
Download the Sales Forecast Example (.zip)
If necessary, see How to extract a .zip file.
Step 1: Creating the Model
We are going to use a top-down approach to create the sales forecast model, starting with:
Profit = Income - Expenses
Both income and expenses are uncertain parameters, but we aren't going to stop here, because one of the purposes of developing a model is to try to break the problem down into more fundamental quantities. Ideally, we want all the inputs to be independent. Does income depend on expenses? If so, our model needs to take this into account somehow.
We'll say that Income comes solely from the number of sales (S) multiplied by the profit per sale (P) resulting from an individual purchase of a gadget, so Income = S*P. The profit per sale takes into account the sale price, the initial cost to manufacturer or purchase the product wholesale, and other transaction fees (credit cards, shipping, etc.). For our purposes, we'll say the P may fluctuate between $47 and $53.
We could just leave the number of sales as one of the primary variables, but for this example, Company XYZ generates sales through purchasing leads. The number of sales per month is the number of leads per month (L) multiplied by the conversion rate (R) (the percentage of leads that result in sales). So our final equation for Income is:
Income = L*R*P
We'll consider the Expenses to be a combination of fixed overhead (H) plus the total cost of the leads. For this model, the cost of a single lead (C) varies between $0.20 and $0.80. Based upon some market research, Company XYZ expects the number of leads per month (L) to vary between 1200 and 1800. Our final model for Company XYZ's sales forecast is:
Profit = L*R*P - (H + L*C)
Y = Profits
X1 = L
X2 = C
X3 = R
X4 = P
Notice that H is also part of the equation, but we are going to treat it as a constant in this example. The inputs to the Monte Carlo simulation are just the uncertain parameters (Xi).
This is not a comprehensive treatment of modeling methods, but I used this example to demonstrate an important concept in uncertainty propagation, namely correlation. After breaking Income and Expenses down into more fundamental and measurable quantities, we found that the number of leads (L) affected both income and expenses. Therefore, income and expenses are not independent. We could probably break the problem down even further, but we won't in this example. We'll assume that L, R, P, H, and C are all independent.
Note: In my opinion, it is easier to decompose a model into independent variables (when possible) than to try to mess with correlation between random inputs.
[ MC Basics ]![]()
![]() [ Generating Random Inputs ]
[ Generating Random Inputs ]
