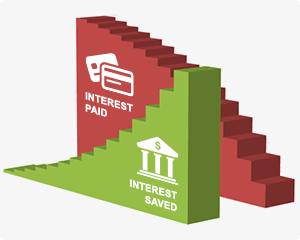
Taking a break from Excel tutorials, this article compares paying off credit card debt to investing. Take an in-depth look at interest rates, liquidity risk, limited return, risk of principal loss, and tax efficiency. Perhaps debt payoff is really my best investment.

A Volatile Function such as RAND, TODAY, OFFSET, or INDIRECT is recalculated every time Excel recalculates. That may be a problem, or it might not be. This article explains why volatile functions may slow performance and also explains why I love them so much.

A Dynamic Named Range is an awesome way to reference customizable lists. This article explains how to use OFFSET, INDEX, INDIRECT, CHOOSE, and IF to create dynamic ranges. It also explains formulas for finding the position of the last value in a range.

I love using drop down lists in Excel. In this article, I’ve tried to explain all of the techniques that I use for making drop-down lists, including simple yes/no options, checkbox substitutes, dependent lists for sub-categories, and using dynamic named ranges.

Learn how to use both VLOOKUP and INDEX-MATCH and other powerful formulas to do lookups in Excel, from simple to advanced formulas, including multiple criteria and case-sensitive lookups and to get the last value in a range.
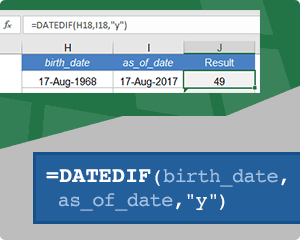
Learn how to Calculate Age in Excel using DATEDIF and other Excel formulas. Calculate age in years or a combination of years, months and days. Learn an accurate work-around for the “md” option.
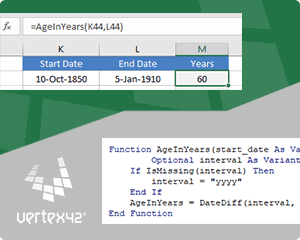
Learn how to create your own custom functions in Excel using VBA. This articles explains the pros and cons of user-defined functions and provides examples.

As an alternative to Power Map or 3D Maps, learn how to create a geometric heat map in Excel using shapes and a simple VBA macro. Guest post by Onur Yilmaz of Someka.net.

20 Excel experts share their lists of favorite Excel functions. If you want to get more out of Excel, try using these functions in your work.

A one-stop reference for using Unicode character symbols in Excel, including ways to insert symbols and how to use them in drop-down lists, number formats, etc. Also includes tables of newer Unicode symbols.

What’s Your Project Management Style Do you have a proven process for project management and business success? Think about the tools you have in place to drive and track your business activities, projects and staff toward the common goal. Are you maximizing your time and capitalizing on activities that make sense? Hoping for the best [...]
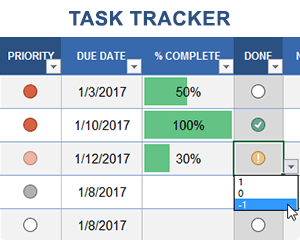
One of the best ways to learn new techniques in Excel is to see them in action. This post demonstrates how to add some fun and useful features to simple to do lists, including drop-down lists, check boxes, and progress bars.

Over the years we’ve created many different types of calendar templates. Choosing the right calendar for the situation is a big part of keeping your daily life in order. Below we talk about 10 ways to use calendar templates effectively to help at home, work and school. Quick Links: 1: Easy reference for your wall [...]
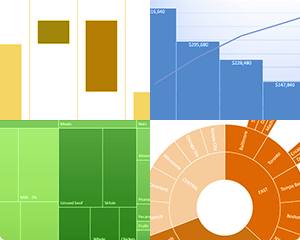
Six awesome new charts! Learn how to create a histogram, box and whisker plot, waterfall, treemap, sunburst, and pareto chart in Excel 2016. By guest author, Kasper Langmann, from Spreadsheeto.com.

Use conditional formatting in Excel to display your data as a calendar chart to visualize data over days, weeks, and months. This post explains how to use the template and answers some questions about how it was created.


